Forget William Marrow: This Is How You’ll Remember Bundle Branch Blocks
A Simplified guide to differentiating RBBB and LBBB on an ECG
Please note: This post explains bundle branch blocks, specifically the right and left bundle branch blocks (RBBB and LBBB). To read about fascicular blocks, specifically the left anterior and posterior fascicular blocks (LAFB and LPFB), please read this post.
The amount of knowledge required of medical students and doctors nowadays is ridiculously extensive. Occasionally, certain memory techniques can help us retain all of this information for the long term, even when we don't fully understand it. There are some highly effective mnemonics available, but in my humble opinion, “William Marrow” is NOT one of them.
“William Marrow” is a mnemonic that you may already have heard of. It “helps” with remembering the pattern of left and right bundle branch blocks (LBBB and RBBB). This mnemonic goes as follows:
WiLliaM: in LBBB, the QRS in V1 looks like a “W”, and the QRS in V6 looks like an “M”
MaRroW: in RBBB, the QRS in V1 looks like an “M”, and the QRS in V6 looks like a “W”
The problem is… they don’t! The QRS often does not look like an “M” or a “W”.
Apart from this problem, there’s a lot of memorising and little understanding if you use this mnemonic. And understanding is a much more powerful learning method to remember something compared to memorising it; there is a whole principle in learning called elaboration; I’ve written an article on how to leverage its power - you can read it here).
Bundle branch blocks are a “right-left” problem
Not politically, but literally.
When there’s an RBBB, there’s a conduction delay in the depolarization of the right ventricle (RV).
When there’s an LBBB, there’s a conduction delay in the depolarization of the left ventricle (LV).
The best anatomical plane to look at differences between right and left is the transverse (horizontal) plane.
Which leads “look” at the heart in the transverse plane? The precordial leads.
Therefore, we can use the precordial leads only to identify the RBBB and LBBB patterns.
V1: this lead looks at the right side of the heart
V6: this lead looks at the left (lateral) side of the heart
Note: V6 can be interchangeably used with other lateral leads (V5, I and aVL) since they all observe the same part of the heart. However, for simplicity, we can rely solely on V6 and still do our work effectively.
The sequence of normal electrical conduction
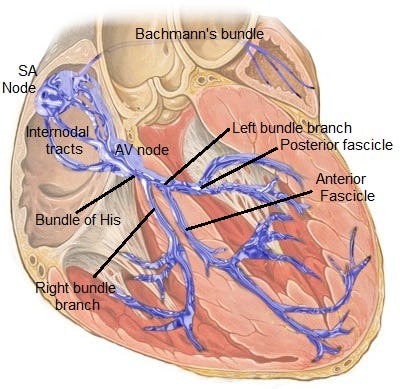
Everything starts from the sinoatrial (SA) node (normally). Electrical activation starts from there and then spreads to the atria. After that, it reaches the atrioventricular (AV) node and, subsequently, the bundle of His (these two structures make up the AV junction, where conduction slows down to allow for atrial contraction to complete before the ventricular contraction starts). Then the electrical stimuli travel through the left and right bundle branches to reach the final Purkinje fibres and then the myocardial fibres.
SA node → RA and LA → AV node → Bundle of His → RBB and LBB → Purkinje fibres → Myocardium

What happens in the ventricles during ventricular depolarization
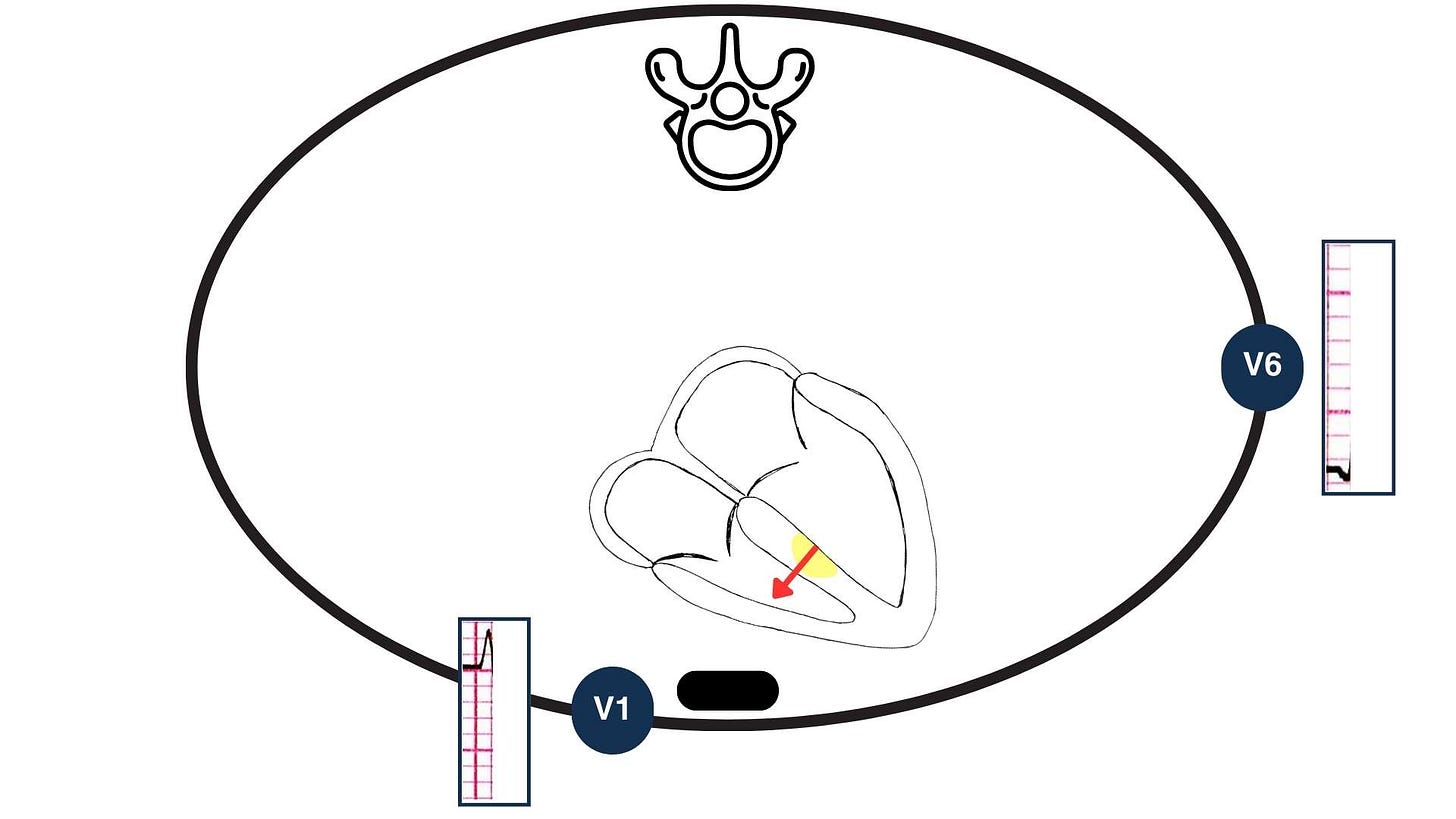
The illustration below shows a simplified version of a transverse section of the thorax at the level of V1 and V6 (which is not the same level, but… I said it’s a simplified version, didn’t I?).
Part 1 of the normal ventricular depolarization
At the start of ventricular depolarization, the interventricular septum depolarizes from LEFT to RIGHT. This produces a small positive deflection in V1 (r wave) as the vector is pointing towards it and a small negative deflection in V6 (q wave) as the vector is pointing away from it.

Part 2 of the normal ventricular depolarization
Now the activation spreads through the right and left bundle branches, followed by the Purkinje fibres inside both ventricles. Because the left ventricular myocardium is larger (normally), the sum of the activation forces will be directed towards it. This leads to a deep negative deflection in V1 (S wave) and a tall positive deflection in V6 (R wave).

The whole process should occur within 120 msec, as there is no conduction delay. Therefore, the QRS will be narrow (< 120 msec in duration).
What happens when there’s an RBBB
Part 1 of the ventricular depolarization in RBBB
In RBBB, the right bundle branch doesn’t work. However, as the left bundle branch still works, the left-to-right interventricular septal depolarization will still occur as normal. This will produce a small r wave in V1 and a small q wave in V6, as shown below:

Part 2 of the ventricular depolarization in RBBB
Now things become different. Because the left bundle branch still works, the LV will be depolarized first via the normal path (through the left bundle branch). Given that the sum of the vectors of the activation forces is aiming towards the left, an S wave will be seen in V1 and an R wave in V6.

Part 3 of the ventricular depolarization in RBBB
Lastly, once the LV has been depolarised, depolarization of the RV will occur through myocyte-to-myocyte spread from the LV myocytes to the RV myocytes (this is possible because the myocytes are connected with gap junctions that allow the transfer of ions).
But this route is not optimised for speed; therefore, the subsequent RV depolarization will be slow (as shown with the dotted arrow). This slow depolarization of the RV will produce a second R’ (R prime) wave in V1 and a wide S (due to the slow speed) in V6.

What happens when there’s an LBBB
LBBB is trickier to explain. Despite extensive research, I have yet to find a satisfying explanation for the exact QRS morphology created in V1 and V6 in LBBB.
For the purpose of simplifying this, and since it's not going to be the end of the world if you don't know the exact electrophysiology of LBBB, I have come up with the following (which is still based on evidence but is not very detailed; in this case, more detail will cause more confusion):
Think of the ventricular activation in LBBB as ONE phase only.
The RV is depolarized first through the right bundle branch. Then, LV depolarization follows through slow myocyte-to-myocyte conduction from the RV to the LV. For this reason, and because the LV has more muscle mass than the RV, in LBBB, we see the following:
In V1: a monophasic negative deflection (a QS wave). Or there might be a small r wave in the beginning (this possibly reflects the initial depolarization of the RV). Notching can sometimes be observed here.
In V6: a monophasic notched R wave (with no Q wave).


The overall impression you get in LBBB is a deep negative wave in V1 (with sometimes an initial small positive wave) and a positive (only) wave in V6.
Also, in LBBB, the QRS is usually wider than in RBBB.
The RBBB and LBBB ECG criteria
‘What’s the R wave peak time?’ I hear you asking.
The R wave peak time (or ventricular activation time or intrinsicoid deflection) is the interval from the onset of the QRS complex until the peak (maximum) of the R wave (or R’ wave, if present). If there’s a second R wave, irrespective of its height compared to the first R wave, the R wave peak time should be measured to the second peak.
The R wave peak time represents how long it takes for the electrical signal to travel from the endocardium to the epicardium.
Summary
So how do you tell if there’s an RBBB or LBBB?
Firstly, is there a significant intraventricular conduction delay/disturbance (IVCD) (i.e. QRS > 120 msec) present?
If there is an IVDC, does it meet the criteria for RBBB or LBBB?
See the flowchart below:

So, I know this has been a lot to take in (unless you already knew how to tell the difference between RBBB and LBBB, in which case... thank you for reading this far, regardless!).
Please take a moment to read through this post. If you have any questions, feel free to ask in the comments or send me an email. I'm happy to discuss any questions you may have individually.
Thanks for reading!
References
Lilly, L. S. (2021). Pathophysiology of Heart Disease (7th ed.). Wolters Kluwer.
Surawicz B, Childers R, Deal BJ, Gettes LS, Bailey JJ, Gorgels A, Hancock EW, Josephson M, Kligfield P, Kors JA, Macfarlane P, Mason JW, Mirvis DM, Okin P, Pahlm O, Rautaharju PM, van Herpen G, Wagner GS, Wellens H; American Heart Association Electrocardiography and Arrhythmias Committee, Council on Clinical Cardiology; American College of Cardiology Foundation; Heart Rhythm Society. AHA/ACCF/HRS recommendations for the standardization and interpretation of the electrocardiogram: part III: intraventricular conduction disturbances: a scientific statement from the American Heart Association Electrocardiography and Arrhythmias Committee, Council on Clinical Cardiology; the American College of Cardiology Foundation; and the Heart Rhythm Society. Endorsed by the International Society for Computerized Electrocardiology. J Am Coll Cardiol. 2009 Mar 17;53(11):976-81. doi: 10.1016/j.jacc.2008.12.013. PMID: 19281930.
Scherbak D, Hicks GJ. Left Bundle Branch Block. [Updated 2023 Feb 6]. In: StatPearls [Internet]. Treasure Island (FL): StatPearls Publishing; 2023 Jan-. Available from: https://www.ncbi.nlm.nih.gov/books/NBK482167/
Pérez-Riera AR, de Abreu LC, Barbosa-Barros R, Nikus KC, Baranchuk A. R-Peak Time: An Electrocardiographic Parameter with Multiple Clinical Applications. Ann Noninvasive Electrocardiol. 2016 Jan;21(1):10-9. doi: 10.1111/anec.12323. Epub 2015 Nov 2. PMID: 26523751; PMCID: PMC6931847.


