
Introduction
On a 12-lead ECG, the QT interval starts from the beginning of the QRS complex until the end of the T wave.
The normal values of the QT interval are:
Before puberty:
360 ms ≤ Normal QTc ≤ 460 ms
Post-puberty:
360 ms ≤ Normal QTc ≤ 440-460 ms in men
360 ms ≤ Normal QTc ≤ 460-480 ms in women
Note that, when measuring the QT interval, we only care about its duration (not morphology or voltage; these are for its individual parts: the QRS complex, ST segment and T wave).

Physiological representation
As seen above, the QT interval includes the following:
QRS complex (ventricular depolarisation)
ST segment (sustained ventricular contraction) [3]
T wave (ventricular repolarisation)
So, essentially, the QT interval represents the time it takes from the start of ventricular depolarisation to the end of ventricular repolarisation.
The QT interval is primarily used to measure ventricular repolarisation. [1]
The importance of the QT interval
I’m not going to get into detail here, but I’d like to give you a general idea of the tremendously important problems that arise from abnormal QT intervals.
You can see two main abnormalities of the QT interval:
Long QT
Short QT
Each one can be acquired or congenital/genetic.
Both increase the risk of arrhythmias and Sudden Cardiac Death (SCD). [2][3][4]
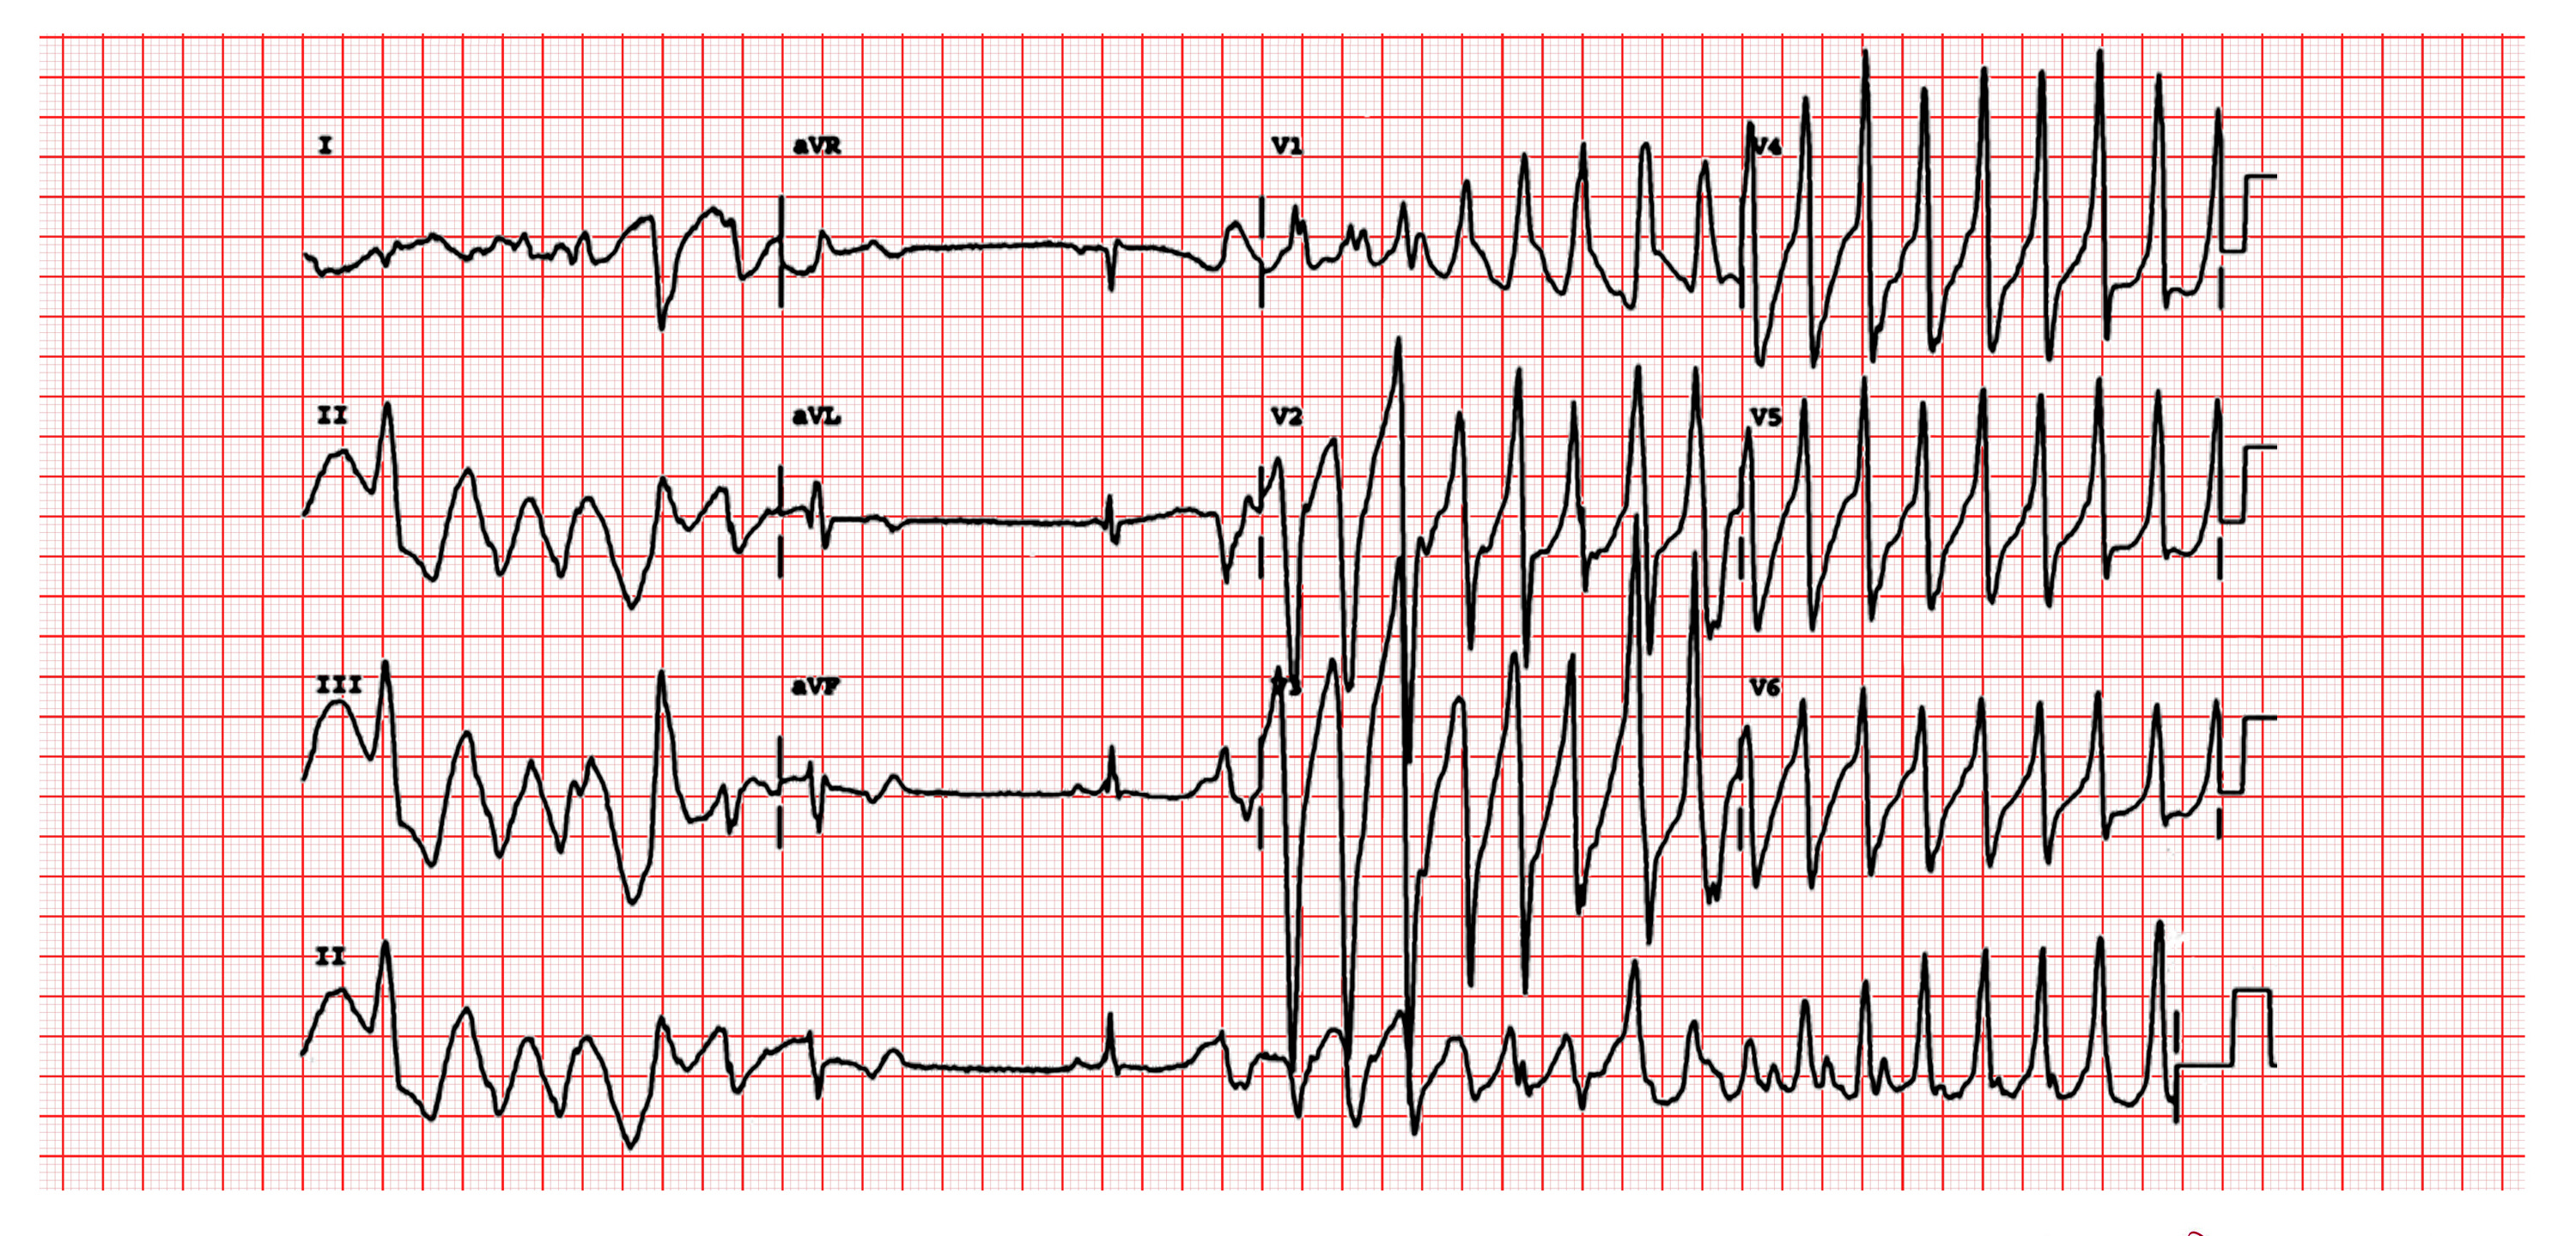
For example, a prolonged QT increases the risk of tachyarrhythmias and, especially, polymorphic ventricular tachycardia (PVT). [3] The most well-known specific form of PVT is Torsades De Pointes. This is what PVT looks like:
Losing a loved one in their prime, with no warning signs or apparent cause, is how long-QT syndrome (LQTS) and short-QT syndrome (SQTS) can manifest themselves.
Take a moment to think about how this impacts their families, friends and society as a whole.
By learning how to tell whether a QT interval is normal or not on a 12-lead ECG, which is so easily accessible nowadays, you can save lives!
How to measure the QT interval
To measure the QT interval correctly, you need to do the following:
Measure the QT interval from the start of the QRS complex to the end of the T wave
Correct the QT interval for heart rate (QTc)
1. Measure the QT interval from the start of the QRS complex to the end of the T wave
Finding the starting point, which is the start of the QRS complex, is simple and straightforward.
However, finding the ending point, the end of the T wave, is not always as easy. Take the following tracing, for example:
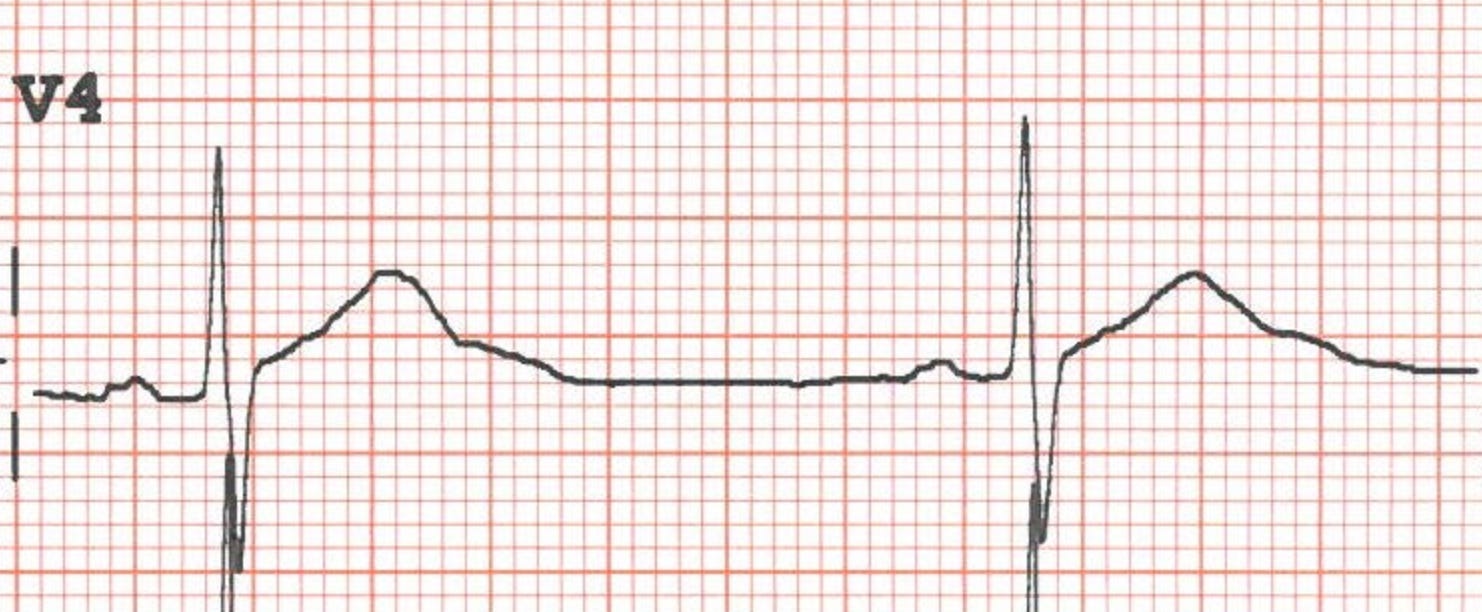
Where does the T wave end? Where arrow A is pointing? Where arrow B is pointing? Somewhere else?

What can you do in cases like this? My approach is the following:
1.a. Check other leads
Maybe V4 is not the best choice here. Let’s see the whole 12-lead ECG:
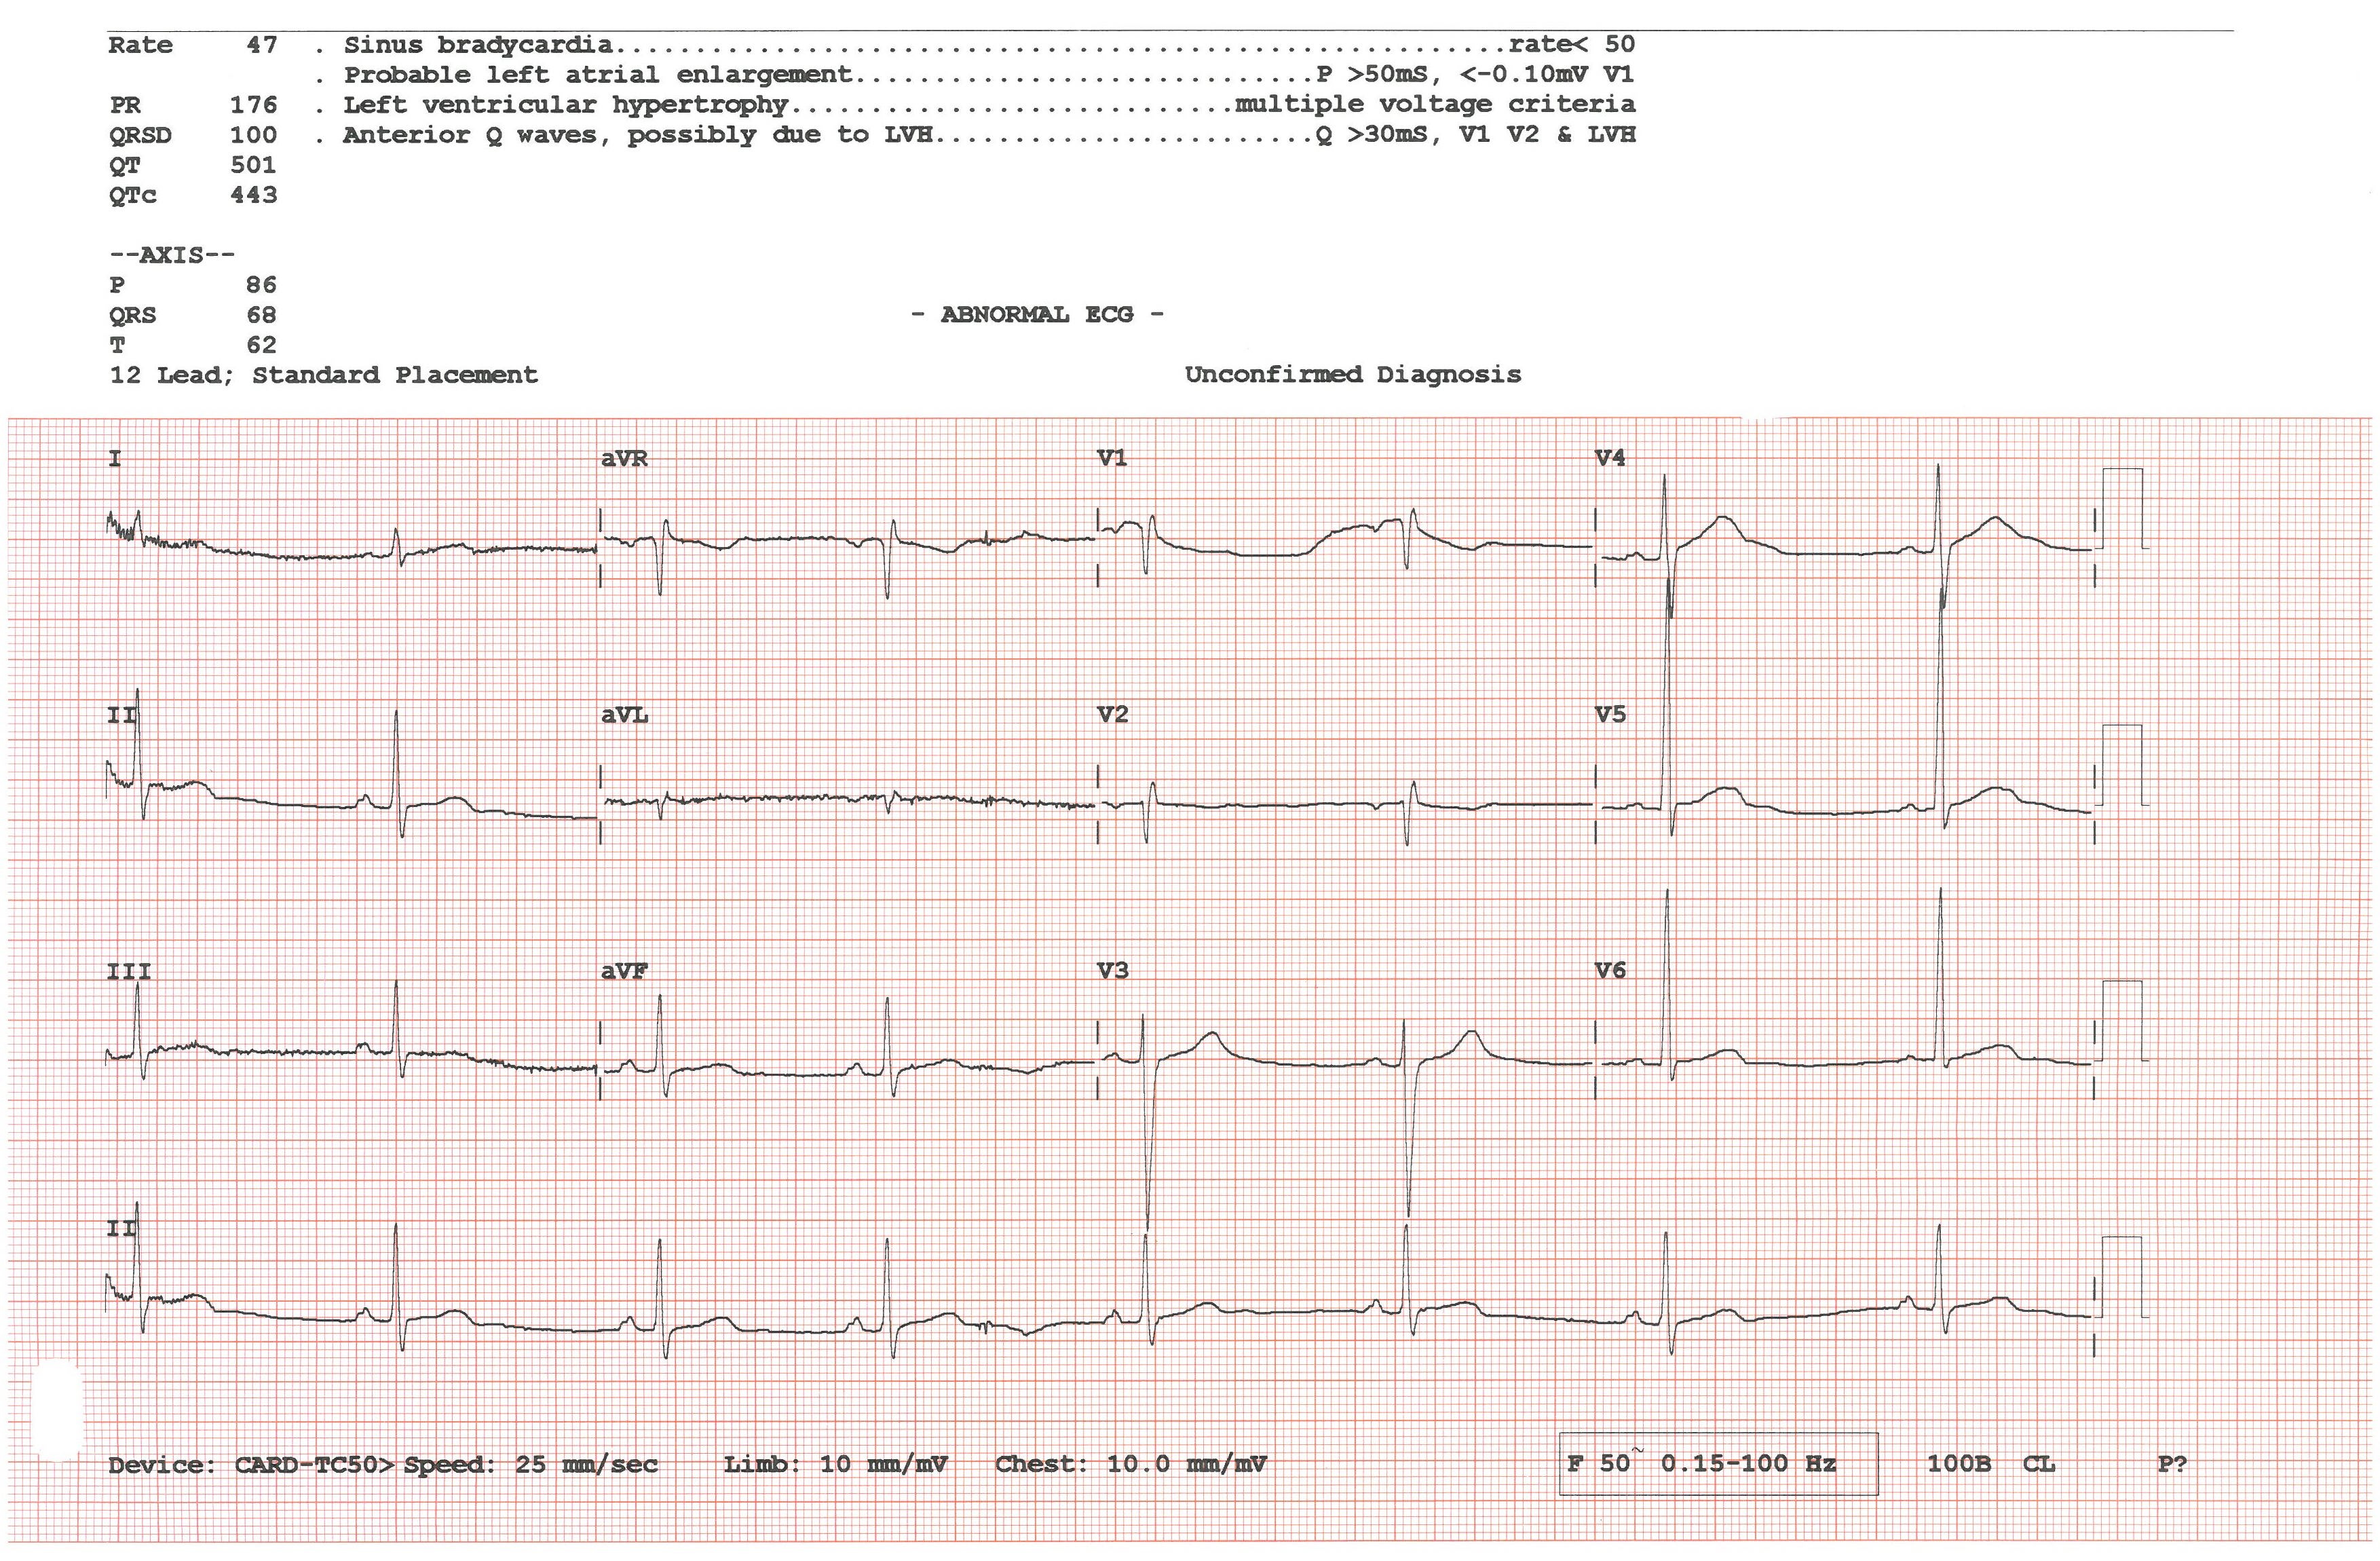
It looks like lead II might be a better choice. Actually, the QT interval is conventionally measured in lead II. The reason is that, in lead II, you rarely have U waves that can complicate things like in the precordial leads (such as V4). [6]
Let’s zoom in on lead II then:

Visualising the end of the T wave in lead II is easier. The point at which the T wave merges with the isoelectric baseline is more clearly defined, and that’s the end of the T wave.
But there’s one more thing that you can do to find the end of the T wave.
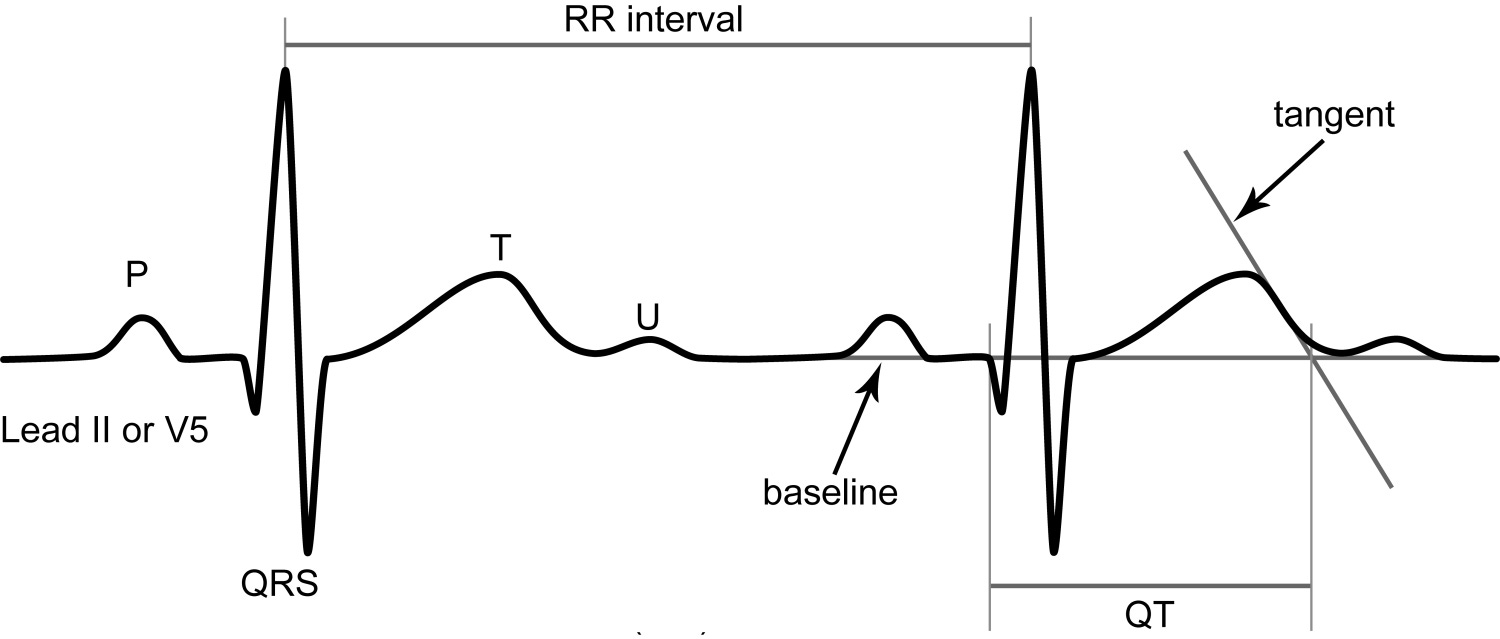
1.b. The tangent method
This method determines the end of the T wave by finding the intersection of a tangent line extending from the maximum downslope point to the isoelectric baseline.
The point where the tangent line meets the isoelectric baseline, as seen in the image below, is where we say the end of the T wave is. [7]
2. Correct the QT interval for heart rate (QTc)
The QT interval is dependent on the heart rate; it is shorter at higher heart rates and longer at lower heart rates. [1]
For this reason, we use formulas to correct the QT for the heart rate, and we get the QTc (QT corrected). The standard practice is always to do this, even if the heart rate is normal.
Which formula to use
If you visit the Corrected QT Interval (QTc) page on MDCalc, you will see that there are different formulas that you can use. So which one should you choose?
The Bazett formula is commonly used to correct the QT interval, but it is inaccurate at heart rate extremes. Fridericia and other methods have also been proposed, but no single formula has been universally adapted due to the significant variability of the QT-RR relationship among individuals. The QT calculators allows comparison of QT correction using the different formulas. [1]
Problems when measuring the QT interval
So far, we have mentioned two commonly encountered problems when measuring the QT interval:
Finding the end of the T wave
Deciding which formula to use to correct the QT interval for heart rate
But there’s one more problem that is less frequently encountered but is quite frustrating (to me, at least): what happens when there's a prolonged QRS complex?
Think about it: we measure the QT interval from the start of the QRS complex. And we use the QT interval measurement to assess the ventricular repolarisation. But, when you have an intraventricular conduction delay (like a bundle branch block), leading to a prolonged QRS (which is not a problem of repolarisation), you’d still get a prolonged QT interval.
In these cases, the prolonged QT interval doesn’t reflect an abnormality of ventricular repolarisation since it’s due to an abnormality of depolarisation.
Researchers are trying to find ways to solve this problem.
One study found that the QT increased by almost 50% of the width of the QRS due to a left bundle branch block and proposed the following formula to calculate the QT:
QTmodified = QTmeasured – 0.5 x QRSmeasured
When using this formula, the result will still need to be corrected for heart rate. [8]
Generally, it’s difficult to say, “Let’s just not include the QRS altogether!” because most of our evidence on the normal range of the QT interval comes from measurements that have included the QRS as well.
Summary
The QT interval starts from the beginning of the QRS complex and ends at the end of the T wave.
It’s used to assess ventricular repolarisation.
As it’s heart rate dependent, it should be corrected using specific formulas (the most commonly used one is the Bazett formula).
The normal values of the QTc are:
Before puberty:
360 ms ≤ Normal QTc ≤ 460 ms
Post-puberty:
360 ms ≤ Normal QTc ≤ 440-460 ms in men
360 ms ≤ Normal QTc ≤ 460-480 ms in women
Abnormal QT values are associated with an increased risk for sudden cardiac death (SCD); therefore, it’s paramount that healthcare professionals know how to measure the QT interval correctly.
Further reading
Jordan M Prutkin, MD, MHA, MHS. ECG tutorial: Basic principles of ECG analysis. Post TW, ed. In: UpToDate, Post, TW (Ed), UpToDate, Waltham, MA, 2023.
Charles Antzelevitch, PhD, FACC, FAHA, FHRS. Short QT syndrome. Post TW, ed. In: UpToDate, Post, TW (Ed), UpToDate, Waltham, MA, 2022.
Charles I Berul, MD. Acquired long QT syndrome: Definitions, pathophysiology, and causes. Post TW, ed. In: UpToDate, Post, TW (Ed), UpToDate, Waltham, MA, 2022.
Peter J Schwartz, MDMichael J Ackerman, MD, PhD. Congenital long QT syndrome: Diagnosis. Post TW, ed. In: UpToDate, Post, TW (Ed), UpToDate, Waltham, MA, 2019.
Kashou AH, Basit H, Malik A. ST Segment. [Updated 2023 Aug 14]. In: StatPearls [Internet]. Treasure Island (FL): StatPearls Publishing; 2023 Jan-. Available from: https://www.ncbi.nlm.nih.gov/books/NBK459364/
Salvi V, Karnad DR, Kerkar V, Panicker GK, Manohar D, Natekar M, Kothari S, Narula D, Lokhandwala Y. Choice of an alternative lead for QT interval measurement in serial ECGs when Lead II is not suitable for analysis. Indian Heart J. 2012 Nov-Dec;64(6):535-40. doi: 10.1016/j.ihj.2012.07.023. Epub 2012 Aug 1. PMID: 23253403; PMCID: PMC3861229.
Panicker GK, Karnad DR, Natekar M, Kothari S, Narula D, Lokhandwala Y. Intra- and interreader variability in QT interval measurement by tangent and threshold methods in a central electrocardiogram laboratory. J Electrocardiol. 2009 Jul-Aug;42(4):348-52. doi: 10.1016/j.jelectrocard.2009.01.003. Epub 2009 Mar 3. PMID: 19261293.
Bogossian H, Frommeyer G, Ninios I, Hasan F, Nguyen QS, Karosiene Z, Mijic D, Kloppe A, Suleiman H, Bandorski D, Seyfarth M, Lemke B, Eckardt L, Zarse M. New formula for evaluation of the QT interval in patients with left bundle branch block. Heart Rhythm. 2014 Dec;11(12):2273-7. doi: 10.1016/j.hrthm.2014.08.026. Epub 2014 Aug 19. PMID: 25149024.