

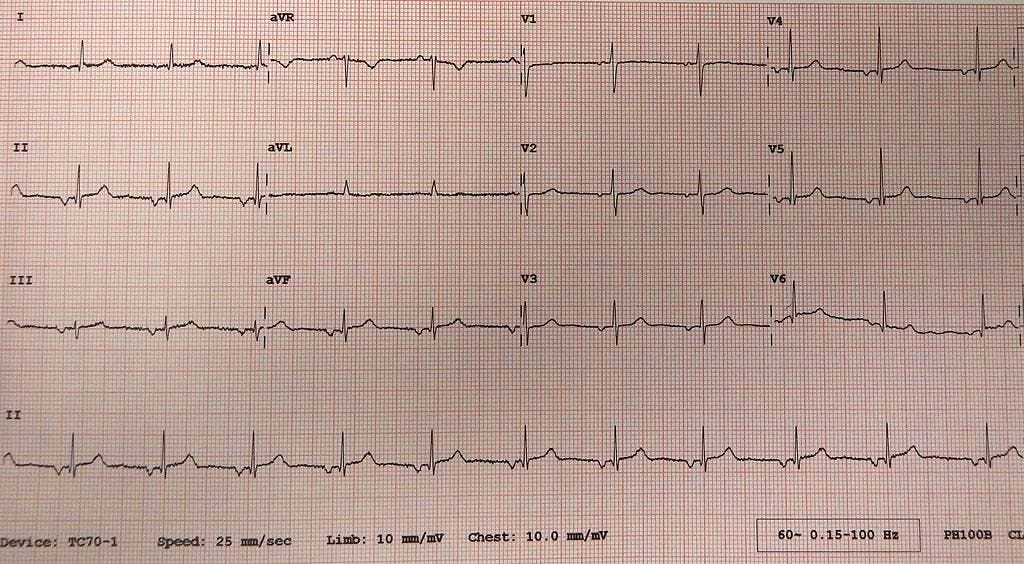
Introductory quiz
Let’s try a quick quiz to warm up first!
Read below for the answers!
If you liked this quiz, feel free to share it with someone who may find it useful!
Physiological representation of the P wave
The P wave represents atrial depolarisation (and not the depolarisation of the sinoatrial (SA) node).
You cannot see the depolarisation of the SA node on a transthoracic ECG (for this, you’d have to place electrodes inside the heart).
However, since atrial depolarisation is a consequence of the depolarisation of the SA node (normally), you can infer that in an ECG showing "normal sinus rhythm," the SA node is (most likely) the pacemaker that initiates everything.
Normal P wave morphology
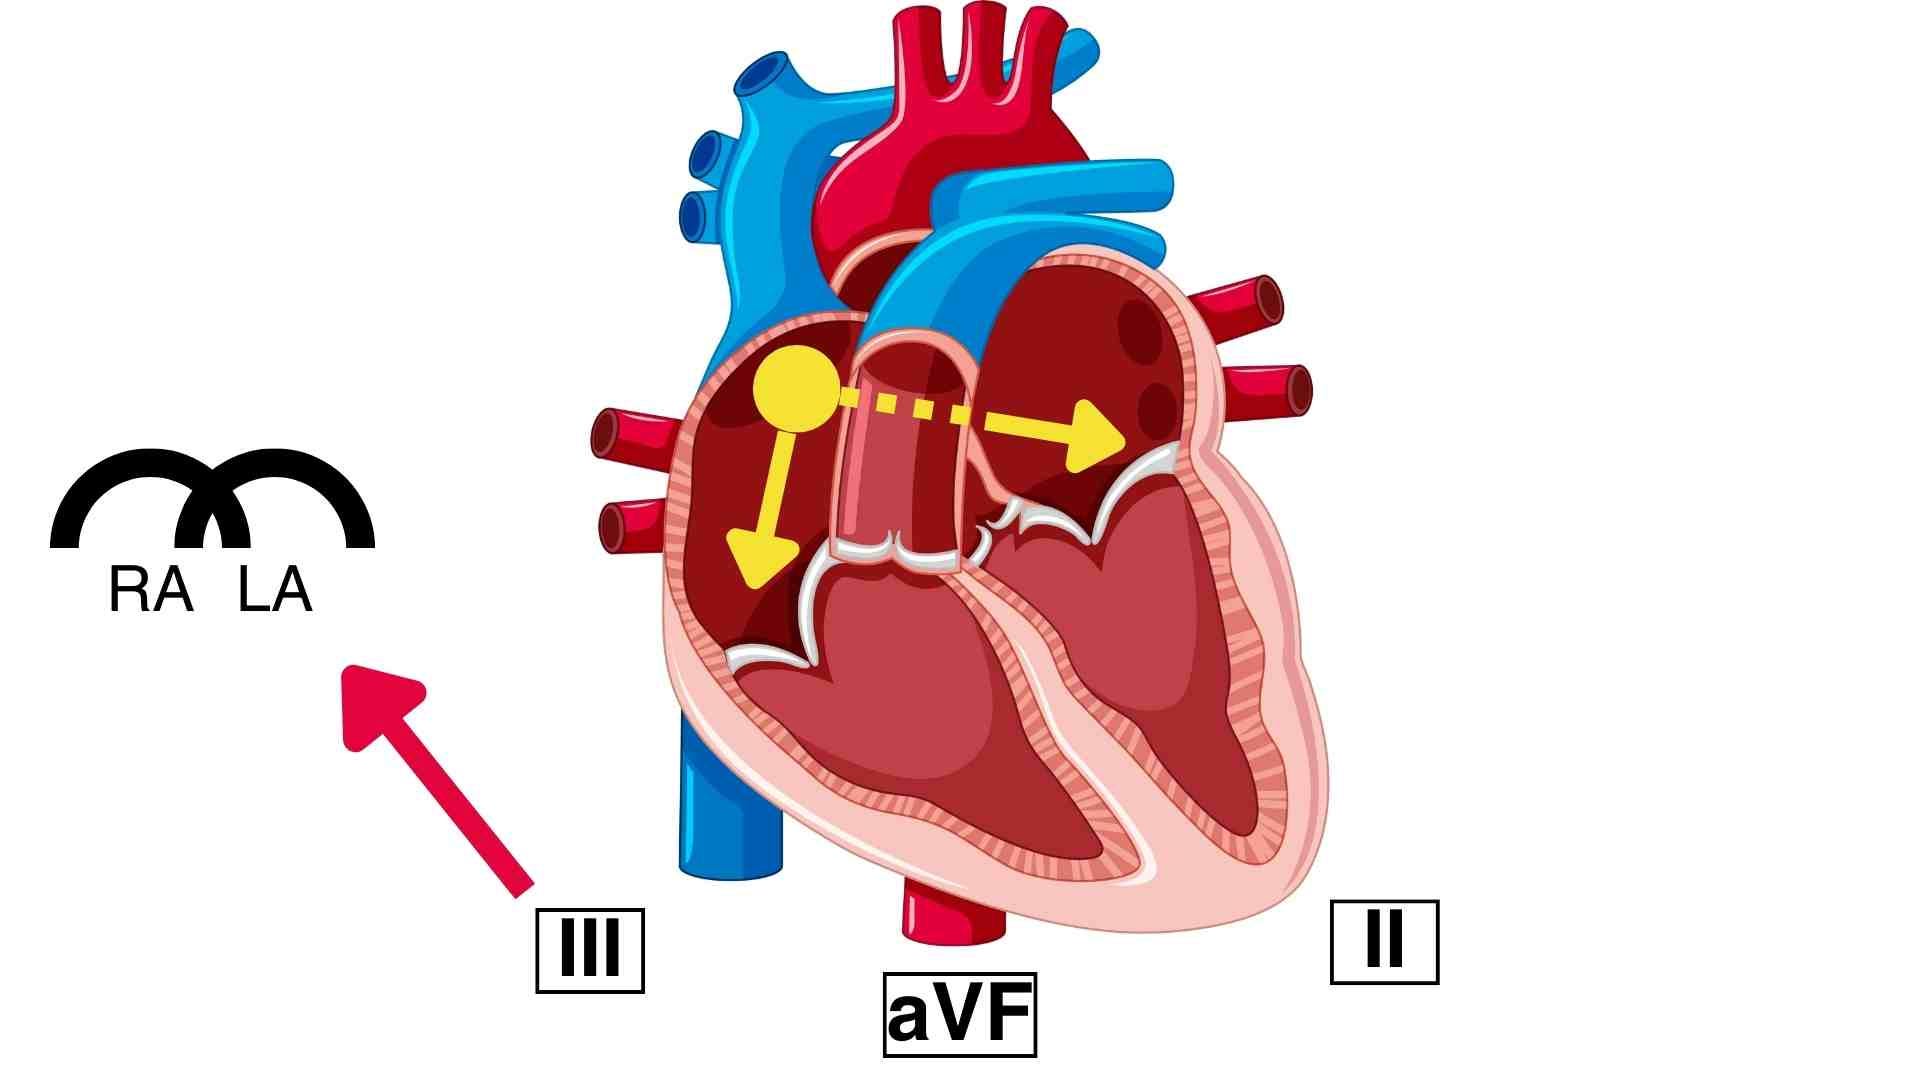
As you may know already, the SA node is located higher up in the right atrium, near the superior vena cava (SVC). Consequently, RIGHT atrial depolarisation precedes LEFT atrial depolarisation.
This is why the P wave is often notched in the limb leads and typically biphasic in lead V1.
Let me explain…
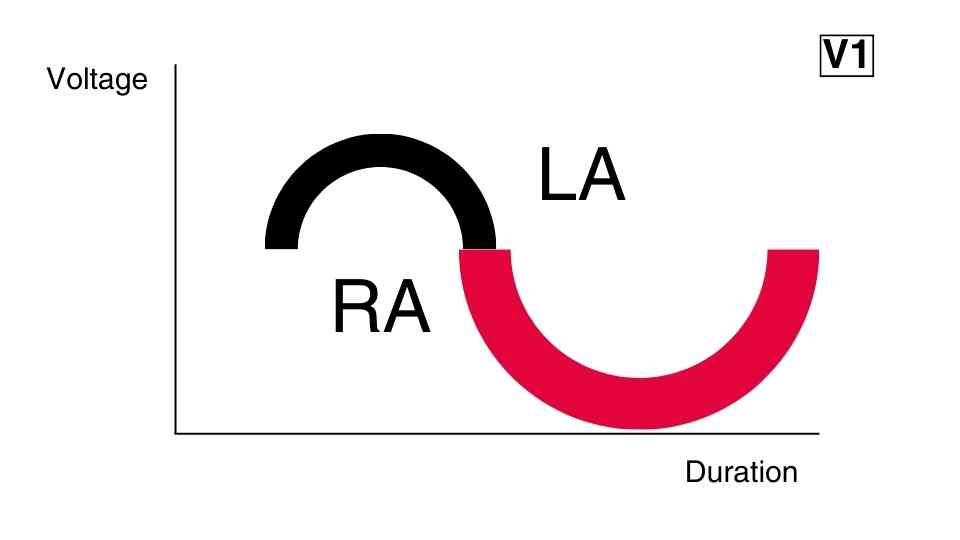
P wave morphology in V1
Think about where V1 is placed (4th intercostal space, right sternal border); now imagine that YOU are the positive electrode of V1, looking at the heart. What would you see? You’d see the right atrium first; further at the back and higher up within the right atrium (RA), you’d see the SA node; THEN you see the left atrium (LA).
RA → SA node → LA (in this order)
The heart has a slight left rotation, which causes the right heart to be in the front (with the right ventricle occupying most of the frontal aspect of the heart) and the left heart to be in the back (with the left atrium occupying most of the posterior aspect of the heart).
Now hit play and visualise the sequence of depolarisation inside the atria. The SA node fires, and then the electrical signal is spread towards all directions. The spread of the electrical signal can be visualised as vectors (like force vectors in physics). The resultant vector (i.e. the vector sum of two or more vectors) is what determines how each wave will appear on the transthoracic ECG:
If the resultant vector points towards a lead's positive pole, the wave appears positive in that lead.
If the resultant vector is perpendicular to a lead's positive pole, the wave appears neither positive nor negative in that lead.
If the resultant vector points away from a lead's positive pole, the wave appears negative in that lead.

This picture has been amended to illustrate how lead V1 captures the normal P wave.
In the picture above, you can clearly see why the P wave appears biphasic (typically) in V1:
The RA depolarises first, as it is closer to the SA node. The resultant vector (yellow arrow in the RA) of depolarisations of the RA is directed towards V1, producing an initial positive deflection. Therefore, the initial positive deflection corresponds to the depolarisation of the RA.
The LA is depolarised slightly later than V1, as it is located a bit further away. The resultant vector (yellow arrow in the LA) aims away from V1, producing a subsequent negative deflection. Therefore, the subsequent negative deflection corresponds to the depolarisation of the LA.
Tip: due to its unique appearance in V1, the P wave is most easily seen in this lead (V1) when it’s difficult to locate P waves elsewhere (say, there are a lot of artefacts in the way).
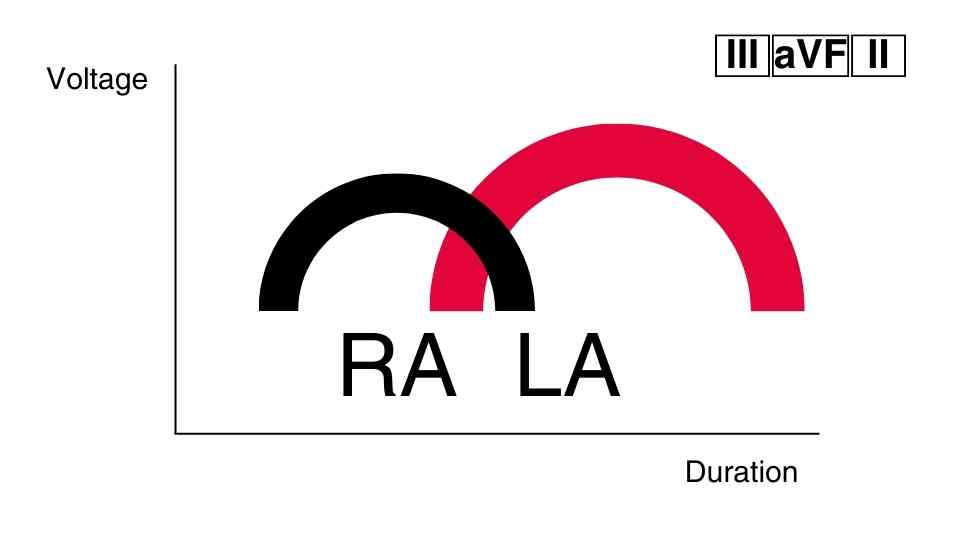
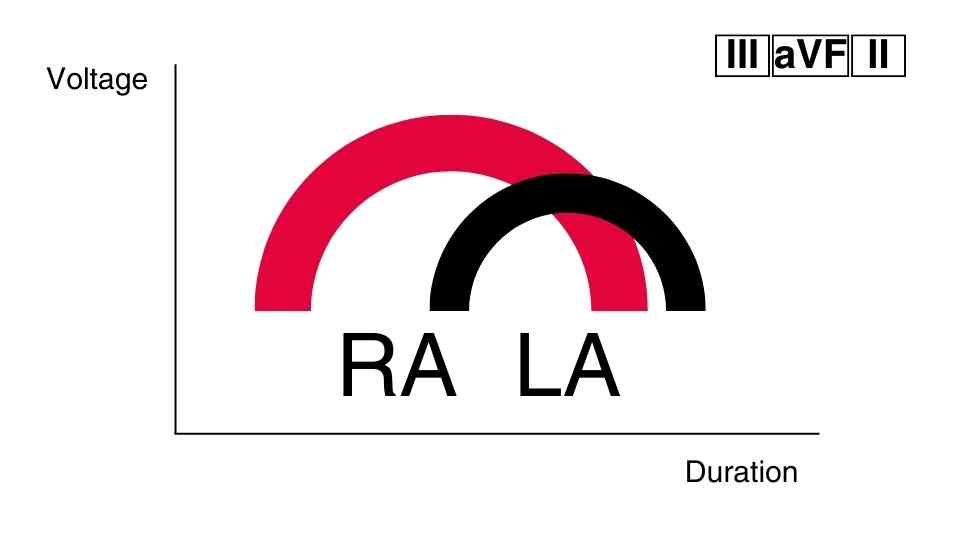
P wave morphology in the inferior leads (II, III, aVF)
In the inferior leads, on the other hand, things are simpler; the P wave should appear positive (if the initial depolarisation started from the SA node).
This is because the SA node is located higher up in the right atrium, causing the resultant vectors in the right and left atria to point downwards towards the positive poles of the inferior leads. (For a better understanding of where the positive poles of the limb leads are, read part 1 and part 2 of the "How to find the QRS axis" posts.)
The notching of the P wave occurs because RA depolarisation precedes LA depolarisation, although both appear as positive deflections in the inferior leads.
Normal P wave duration
The normal duration of the P wave is less than 120 msec (i.e. less than 3 mm length if the recording speed is 25 mm/sec).
A P wave duration that is greater than 120 msec indicates left atrial abnormality (such as hypertrophy, enlargement, conduction delay etc.).
LA abnormality causes enlargement of the LA component of the P wave.
This prolongs the P wave since the LA component is the terminal component of the P wave (as LA depolarisation follows RA depolarisation). Additionally:
In the inferior leads, you will see a prolongation of the P wave and a more prominent notch in the middle (as the second P wave component becomes larger). This P wave morphology is often termed P mitrale.
In V1, you will see that the terminal negative deflection of the P wave is more prominent, specifically more than 40 msec (1 mm).
In summary, the following P wave features indicate LA abnormality:
P wave prolongation (> 120 msec)
a P wave in V1 with its negative terminal part being greater than 40 msec,
Normal P wave voltage
The normal voltage of the P wave is less than 0.25 mV (i.e. less than 2.5 mm amplitude if the calibration of voltage is set at 10 mm/mV).
A P wave voltage that is greater than 0.25 mV indicates right atrial abnormality. In right atrial abnormality, the RA component of the P wave becomes larger.
However, since the RA component precedes the LA component, its enlargement will NOT cause prolongation of the P wave. Instead, it will produce a TALL P wave with a voltage greater than 0.25 mV, which is peaked and lacks a notch in the middle. This type of P wave is typically referred to as P pulmonale.
In contrast to LA abnormality, we don’t usually refer to any specific findings in V1 to identify RA abnormality. We rely only on the inferior leads, where the P pulmonale is most prominent when present.
So, a high P wave voltage (> 0.25 mV) indicates a RIGHT atrial abnormality.
Question 4: What rhythm does the ECG in the quiz above most likely demonstrate?
The ECG characteristics of the normal sinus rhythm are the following:
NORMAL P WAVE AXIS (0° to +90°)
This is something that we haven't discussed yet, but it's important to note. The normal "sinus" P wave, which is the result of the initial SA depolarisation, is usually positive in the inferior leads and negative in aVR.
There is a 1:1 AV association. This means that after every P wave, there is a QRS complex, and before every QRS complex, there is a P wave.
An atrial and ventricular depolarisation rate between 60 and 100 bpm. If the first two criteria are met, but:
the rate is less than 60 bpm, then this would be termed sinus bradycardia
the rate is more than 100 bpm, then this would be termed sinus tachycardia
Therefore, in the ECG shown in the quiz, the rhythm is NOT sinus because the P wave axis is abnormal. The P wave is negative in the inferior leads and positive in aVR, which is the opposite of what we would expect, given that the leads have been placed correctly (lead misplacement is beyond the scope of this article).
Hence, the ECG in the quiz shows (most likely) an ectopic atrial rhythm, meaning that a different focus (different than the SA node - an ectopic focus) initiates the depolarisation of the atria and is currently the heart’s pacemaker.
This focus is most likely closer to the bottom of the atria; therefore, the resultant vector is going upwards, away from the inferior leads and towards lead aVR.
Summary
The P wave represents atrial depolarisation.
The normal duration of the P wave is less than 120 msec
The normal voltage of the P wave is less than 0.25 mV
A normal sinus rhythm should have normal "sinus" P waves (including a normal P-wave axis)
Questions for you
Where do you think the terms P mitrale and P pulmonale come from?
What if we have both LA and RA abnormalities? What ECG findings would you expect to find then?
Which part of the heart is the oesophagus in close proximity to? Can you think of a clinical use case that utilises this fact of anatomy?
Further reading
Lilly, L. S. (2021). Pathophysiology of Heart Disease (7th ed.). Wolters Kluwer.
Douedi S, Douedi H. P wave. [Updated 2022 Jul 25]. In: StatPearls [Internet]. Treasure Island (FL): StatPearls Publishing; 2023 Jan-. Available from: https://www.ncbi.nlm.nih.gov/books/NBK551635/#